Note
Click here to download the full example code
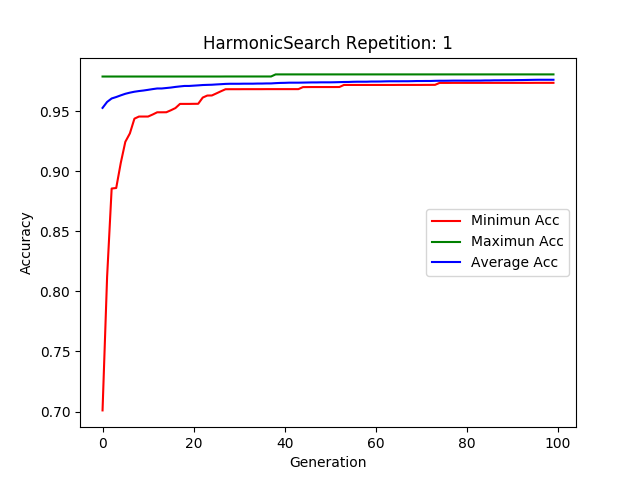
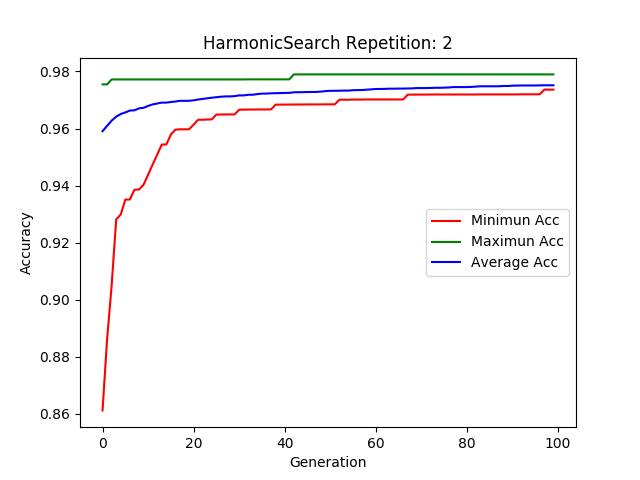
Plotting MetaHeuristics - Basic Use
An example plot of :class:`feature_selection.HarmonicSearch
Out:
d
Number of Features Selected:
         HS:  0.6666666666666666 %       GA:  0.5666666666666667 %
Accuracy of the classifier:
         HS:  0.9807156598691804         GA:  0.9806848787995384
from feature_selection import HarmonicSearch, GeneticAlgorithm
from sklearn.datasets import load_breast_cancer
from sklearn.svm import SVC
dataset = load_breast_cancer()
X, y = dataset['data'], dataset['target_names'].take(dataset['target'])
# Classifier to be used in the metaheuristic
clf = SVC()
hs = HarmonicSearch(classifier=clf, random_state=0, make_logbook=True,
repeat=2)
ga = GeneticAlgorithm(classifier=clf, random_state=1, make_logbook=True,
repeat=2)
# Fit the classifier
hs.fit(X, y, normalize=True)
ga.fit(X, y, normalize=True)
print("Number of Features Selected: \n \t HS: ", sum(hs.best_mask_)/X.shape[1],
"% \t GA: ", sum(ga.best_mask_)/X.shape[1], "%")
print("Accuracy of the classifier: \n \t HS: ", hs.fitness_[0], "\t GA: ",
ga.fitness_[0])
# Transformed dataset
X_hs = hs.transform(X)
X_ga = ga.transform(X)
# Plot the results of each test
hs.plot_results()
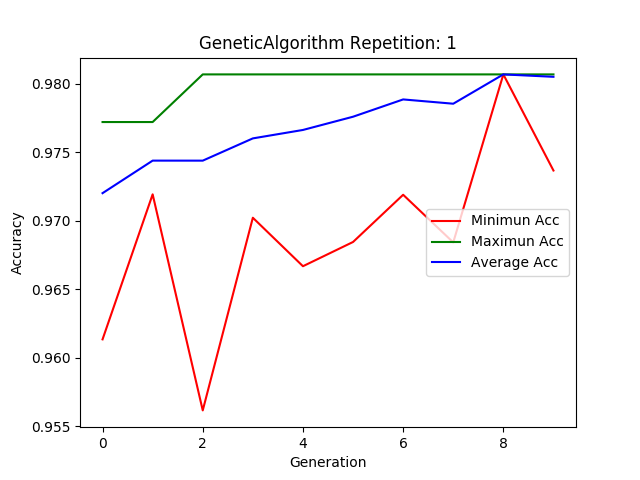
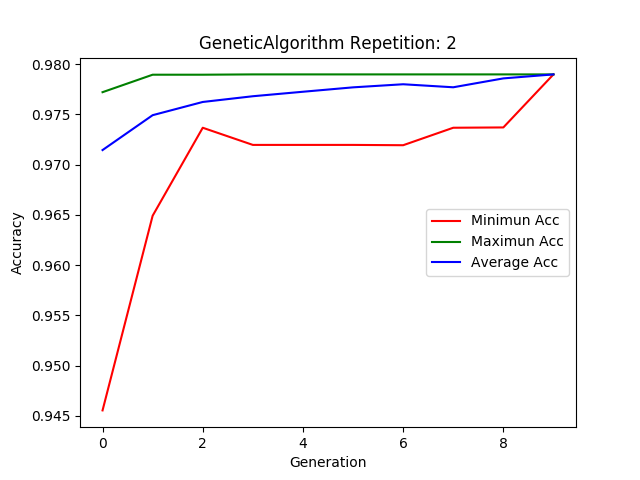
ga.plot_results()
Total running time of the script: ( 0 minutes 43.391 seconds)